Where I slept in 2015
This year has been an adventure. I’ve been on three continents, countless countries and dozens of cities.
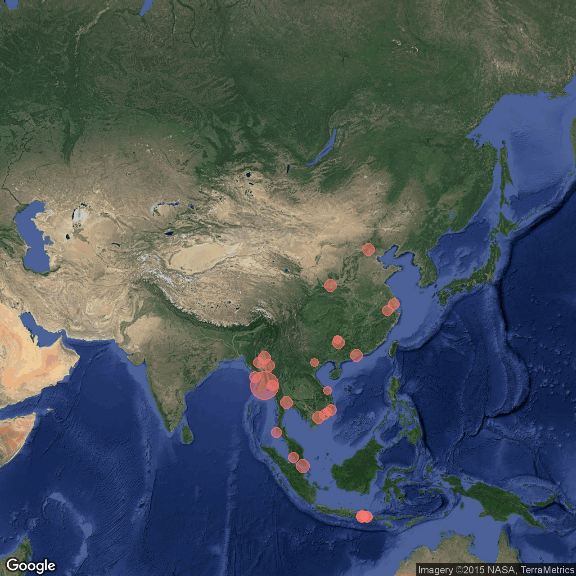
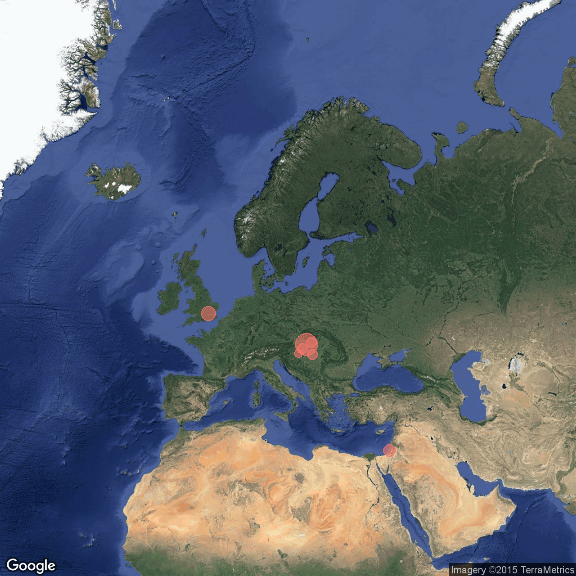
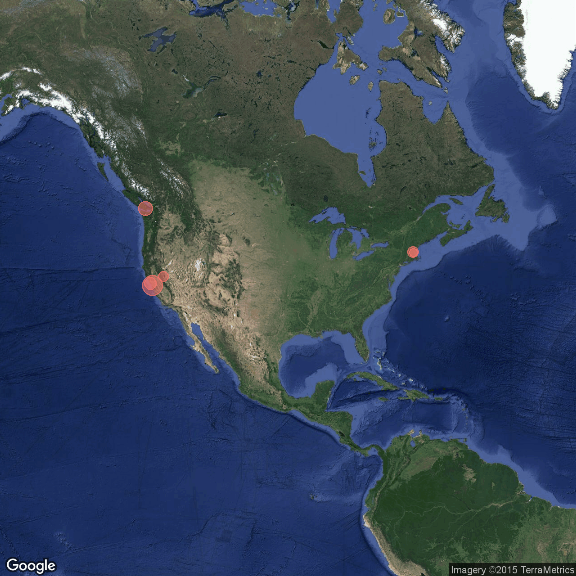
I thought it would be an interesting project to quantify it all by visualising on a map the places where I slept.
This is the result:


imgLeft: images/USA2015.png
In case you are interested in how I did it you can find the code below. I was inspired by this blog post.
library(readr)
library(ggmap)
library("shiny")

days<-read_csv("daysinayear/days.csv")# spreadsheet with place in one column and days slept in another
devtools::install_github("bwlewis/rthreejs")
#First step: get lat and lng for where I've slept using Google Maps API
x<-geocode(days$Location)
days<-cbind(days,x)

# Make a cool spinning globe
globejs(img="http://2.bp.blogspot.com/-Jfw4jY6vBWM/UkbwZhdKxuI/AAAAAAAAK94/QTmtnuDFlC8/s1600/2_no_clouds_4k.jpg",
        lat = days$lat,lon = days$lon, value=days$Days,bg="white", atmosphere = TRUE, color = "red")

#create the square plots for Asia, Europe and USA
windows(6,6);
asiaPlot <- qmap(location = "Asia", zoom = 3, legend = "none", maptype = "satellite", darken = 0.01, extent = "device")
asiaPlot <- asiaPlot +
  geom_point(data = days, aes(y = lat, x = lon, colour = "blue", size=Days, alpha=.5,show_guide = FALSE))+
  guides(color=F, size = F,alpha = F)
(asiaPlot <- asiaPlot + scale_size_continuous(range = c(3,10)))

windows(6,6);
eurPlot  <- qmap(location = "Europe", zoom = 3, legend = "none", maptype = "satellite", darken = 0.01, extent = "device")
eurPlot  <- eurPlot  +
  geom_point(data = days, aes(y = lat, x = lon, colour = "blue", size=Days, alpha=.5,show_guide = FALSE))+
  guides(color=F, size = F,alpha = F)
(eurPlot  <- eurPlot  + scale_size_continuous(range = c(3,10)))

usPlot  <- qmap(location = "USA", zoom = 3, legend = "none", maptype = "satellite", darken = 0.01, extent = "device")
usPlot  <- usPlot  +
  geom_point(data = days, aes(y = lat, x = lon, colour = "blue", size=Days, alpha=.5,show_guide = FALSE))+
  guides(color=F, size = F,alpha = F)
(usPlot  <- usPlot  + scale_size_continuous(range = c(3,10)))